Elena Jung · 6 October 2026
Data Analytics Drive Adjustments in Maritime Insurance Premiums for Low-Visibility Coastal Zones
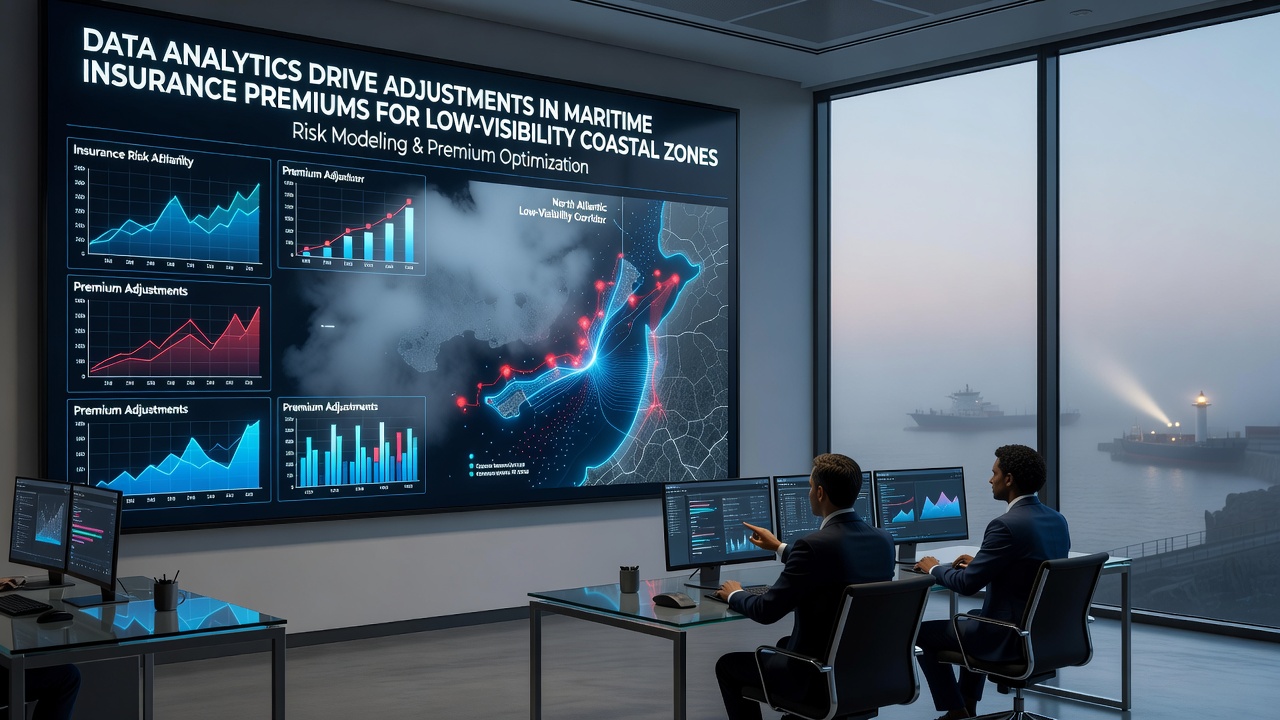
Maritime insurers have begun incorporating advanced data analytics into premium calculations for vessels operating in low-visibility coastal zones, where fog, mist, adn haze increase collision and grounding risks. These adjustments rely on aggregated datasets from satellite imagery, buoy sensors, and port authority records that track visibility conditions across major harbors. In October 2026, several carriers reported shifts in rate structures for routes near the Pacific Northwest and North Sea approaches after new modeling tools processed multi-year visibility patterns.
Core Data Inputs Shaping Risk Models
Analysts pull visibility metrics from networks operated by the National Oceanic and Atmospheric Administration alongside complementary feeds from the European Maritime Safety Agency, then layer vessel traffic density and historical incident reports to generate zone-specific risk scores. Researchers at coastal universities have cross-referenced these streams with automatic identification system logs, revealing that certain harbor approaches experience visibility below 500 meters for up to 18 percent of peak shipping hours during fall and winter months. Insurance underwriters feed the resulting indices into actuarial tables, allowing premiums to reflect localized exposure rather than broad regional averages.
Integration of Real-Time and Historical Records
Port authorities in Vancouver and Rotterdam now share anonymized transit data that includes time-stamped visibility readings, and this information flows directly into third-party analytics platforms used by Lloyd's syndicates. When models detect sustained periods of reduced visibility coinciding with high traffic volumes, the algorithms flag elevated probabilities for delays or minor contacts, prompting incremental premium uplifts of 4 to 12 percent on affected policies. Observers note that carriers operating frequent short-sea routes absorb the largest revisions because their vessels accumulate more exposure hours within the monitored zones.
Geographic Variations in Premium Recalibrations
Routes along the Australian Bass Strait have seen modest downward adjustments where improved buoy coverage and predictive fog models demonstrate lower incident rates than earlier estimates suggested. In contrast, insurers applied upward corrections along segments of the U.S. Gulf Intracoastal Waterway after data revealed persistent morning haze layers that coincide with barge convoys. The Australian Maritime Safety Authority publishes quarterly visibility summaries that underwriters reference when validating these regional differences, and similar bulletins from Transport Canada support parallel recalibrations for Atlantic Canada ports.
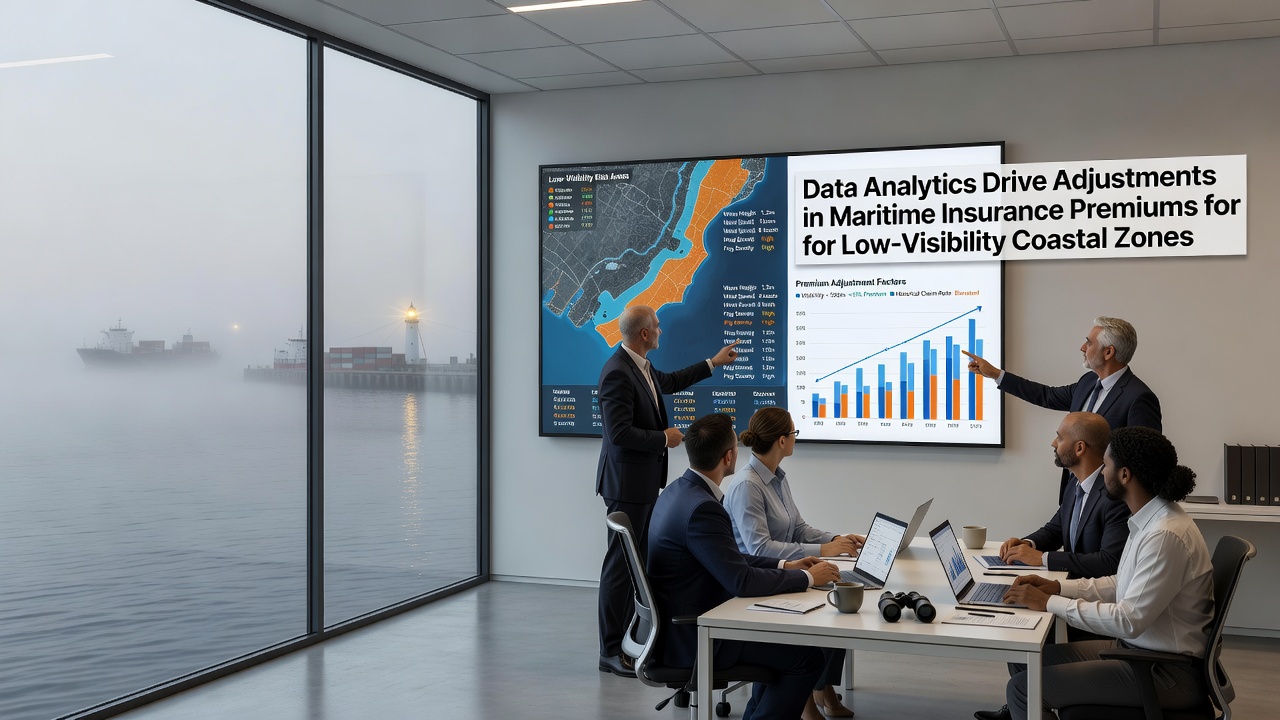
One study released in 2025 by a consortium of European research institutes examined five years of low-visibility events and found that ports equipped with dense sensor arrays recorded 23 percent fewer insurance claims than comparable facilities relying on meteorological forecasts alone. Underwriters have cited these findings when negotiating renewals, particularly for tankers and container ships that maintain tight schedules through known fog corridors. The same datasets also highlight seasonal spikes, prompting carriers to incorporate dynamic routing clauses that can trigger mid-policy premium credits if vessels avoid high-risk windows.
Operational Responses from Shipping Lines
Fleet managers have started reviewing analytic dashboards before voyage planning, and several operators now schedule departures around forecasted visibility windows to stay within lower-premium brackets. Data platforms aggregate live readings from coastal radar and lidar stations, then translate those readings into risk-weighted route alternatives that insurers accept as mitigating factors. In October 2026, a trans-Pacific liner service reported completing 14 consecutive fog-season transits without triggering supplemental charges after adhering to model-recommended timing, illustrating how operational adjustments can offset analytic premium changes.
Regulatory and Industry Alignment
Classification societies have begun incorporating visibility analytics into their risk assessment frameworks, which insurers then reference during policy reviews. This alignment reduces duplication of data collection efforts and creates standardized inputs that multiple carriers can apply consistently. Industry working groups continue to refine threshold definitions, such as the exact visibility duration that constitutes an elevated-risk period, to ensure models remain comparable across jurisdictions.
Conclusion
Maritime insurance pricing for low-visibility coastal zones continues to evolve as analytics platforms integrate broader sensor networks and longer historical records. Shipping operators, port authorities, and underwriters now share structured datasets that translate localized visibility patterns into measurable risk variables, producing premium structures that respond to actual operating conditions rather than uniform regional factors. As additional ports deploy standardized monitoring equipment, the granularity of these adjustments is expected to increase further.