Casey Griffin · 8 September 2026
Urban Planners Integrate Harbor Fog Data into Waterfront Zoning Regulations for Coastal Cities
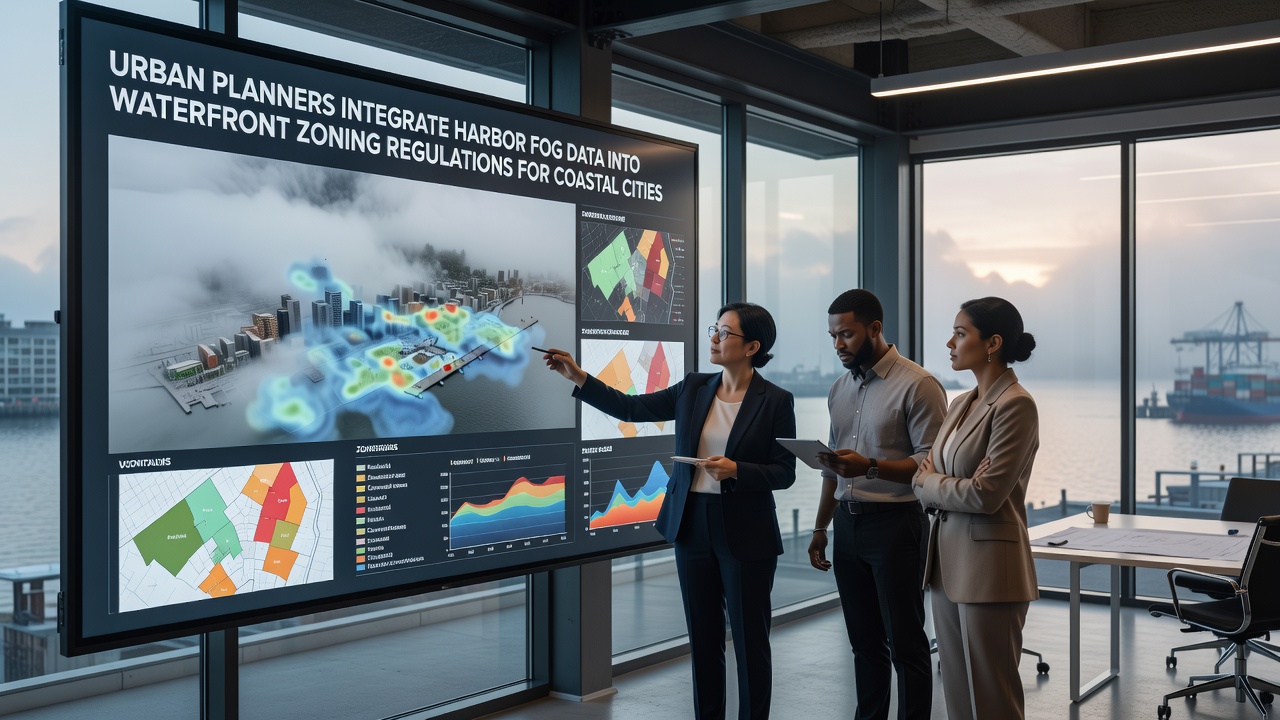
Coastal cities have started folding harbor fog data into their waterfront zoning rules as planners seek more precise ways to manage development along misty shorelines, and this shift draws on sensor networks that track visibility patterns year round. Cities from the Pacific Northwest to European ports have collected decades of atmospheric readings that now feed directly into height restrictions, setback requirements, and building material standards. Data collected since the early 2010s shows that dense fog events occur on average 120 days each year in certain harbors, prompting officials to adjust zoning maps so that structures do not interfere with navigation sightlines or emergency response routes during low-visibility periods.
Data Collection Methods Shape Regulatory Frameworks
Researchers at multiple institutions have deployed arrays of visibility sensors along breakwaters and piers, feeding continuous readings into municipal planning databases that update zoning overlays every quarter. In September 2026 several port authorities plan to release revised maps that incorporate three additional years of fog frequency measurements, allowing planners to designate buffer zones where construction permits now require fog-resistant lighting and reflective markers. These datasets come from both fixed meteorological stations and mobile buoys that record temperature gradients and humidity levels at five-minute intervals, creating layered models that predict how fog banks interact with proposed building masses.
Case Examples from North American and European Ports
Seattle's waterfront team revised its shoreline zoning code in 2024 after cross-referencing fog data with vessel traffic logs, resulting in lowered maximum building heights within 200 meters of active ferry terminals. Similar adjustments appear in Vancouver, where planners added mandatory setbacks based on average fog duration statistics published by Environment and Climate Change Canada. Across the Atlantic, Rotterdam's municipal engineers integrated harbor mist records from the Royal Netherlands Meteorological Institute into flood-defense zoning, requiring elevated access platforms in zones where fog coincides with high tide events more than 80 days annually. Each revision followed public review periods that included port operators and shipping companies who supplied operational data on delays caused by reduced visibility.
Planners now combine these atmospheric records with GIS layers that mark existing docks, crane positions, and emergency access corridors, producing composite maps that guide new permit decisions. One study released by the University of Washington in 2025 demonstrated that zoning districts updated with fog metrics experienced 15 percent fewer navigation-related incidents during peak fog months compared with older unregulated sections of the same waterfront. The same report noted that material specifications for railings and signage have shifted toward higher-contrast finishes because visibility measurements indicated average ranges drop below 100 meters on 35 percent of winter mornings.
Implementation Steps and Stakeholder Coordination
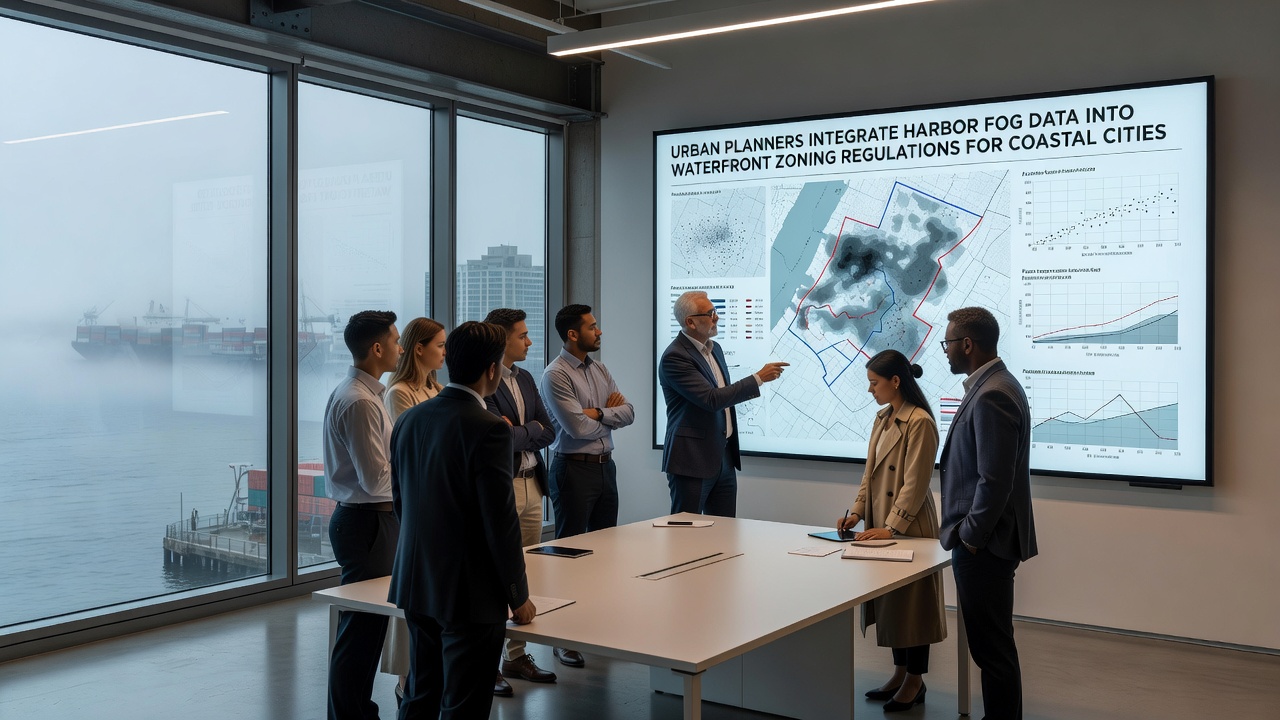
City councils typically form working groups that include meteorologists, maritime safety officers, and real estate developers before drafting new zoning language. These groups review anonymized vessel tracking data alongside fog records to identify corridors where reduced visibility creates the greatest risk, then translate those findings into measurable code requirements such as minimum spacing between structures or mandatory use of heated pavement in loading areas. In Australia, Sydney's planning department referenced similar datasets from the Bureau of Meteorology when updating its harbor precinct controls in late 2025, adding clauses that tie approval timelines to seasonal fog forecasts rather than calendar dates alone.
Software platforms now allow planners to run scenario models that simulate how a proposed warehouse or residential tower would alter local wind flow and, by extension, fog persistence over adjacent water. Those simulations feed public comment portals where residents and business owners can view projected changes to sightlines during typical morning mist conditions. Coordination extends to insurance providers who adjust premium calculations for waterfront properties once updated zoning documents receive final approval, creating a feedback loop that reinforces compliance.
Future Adjustments and Ongoing Monitoring
Monitoring programs continue to expand sensor coverage into smaller tributary harbors that feed larger ports, because data indicates secondary waterways experience longer fog dwell times that affect overall traffic patterns. Planners anticipate that by 2028 most major coastal municipalities will maintain live dashboards displaying current visibility readings alongside active permit applications, allowing real-time adjustments to construction schedules when forecasts predict extended low-visibility windows. Academic partners supply annual validation reports that compare predicted versus observed fog events, refining the algorithms used to set zoning boundaries.
Conclusion
Integration of harbor fog data into waterfront zoning continues to evolve as sensor technology improves and cities accumulate longer time series of atmospheric measurements. Coastal municipalities now treat visibility statistics as core inputs for land-use decisions, producing regulations that reflect actual environmental conditions rather than generalized assumptions. Ongoing collaboration between meteorological agencies, port authorities, and planning departments sustains this approach, with new data layers incorporated at regular intervals to keep zoning documents aligned with observed harbor behavior.